
Product Tour
Data, Designed Specifically For You
We made it our mission to put insights on your Amazon Seller data at your fingertips.
No Digging Around.
No Running Multiple Reports.
Just Connect and Go.
Period-over-period Comparisons that are interactive, sortable and exportable

How It Works
Just a few steps to sign up, connect your data and start seeing your Amazon Seller insights.

Sign Up for a Free Trial
Try our service out with a
14-day, cancel-anytime trial

Link Amazon Accounts
Connect your advertising and marketplace accounts with our simple 3-step wizard

Alyte Does the Rest
No additional setup. Your data is automatically imported and updated dynamically on your dashboard
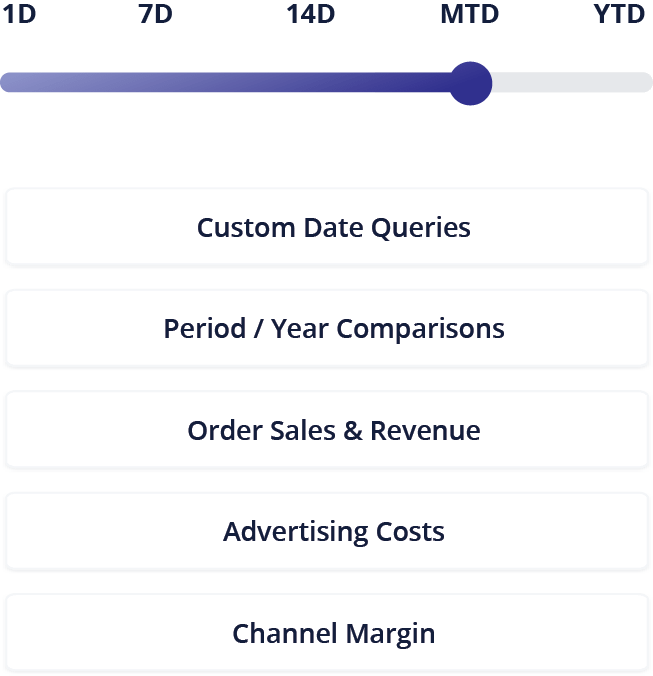
Powerful Insights and Interactions
Key data points with selectable dates periods or set a custom range.
Dashboard Overview
See overall Amazon channel performances at a glance; over time with key metrics and any date range to compare changes.

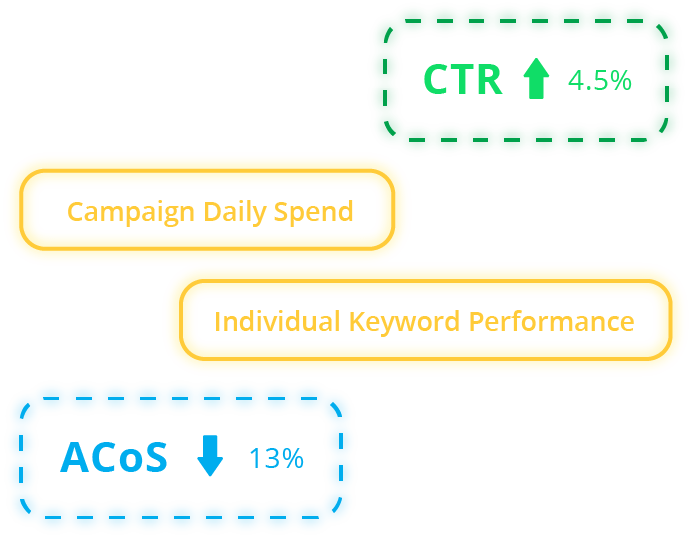

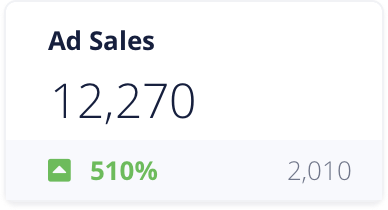
Amazon Advertising Performance
Deep dive into Amazon Advertising Performance, including overall ad sales and spend over time, campaign and keyword performance.
DSP and Promotions performance, including Subscribe & Save and Coupons.
Inventory
Reporting
Get a complete FBA inventory picture that includings unit inbound and in FBA working plans and compare against sales velocity to plan your strategy.


Multi-Seller Account Performance Reporting
Summary page showing performance across multiple Seller accounts in one view and drill-down into detail reporting on individual seller accounts
How is your Channel Performing?
Understand margin and make decision based on SKU performance.

SKU Performance
Drill-down in into performance, include sales and units over time by parent or child with ad performance by SKU.
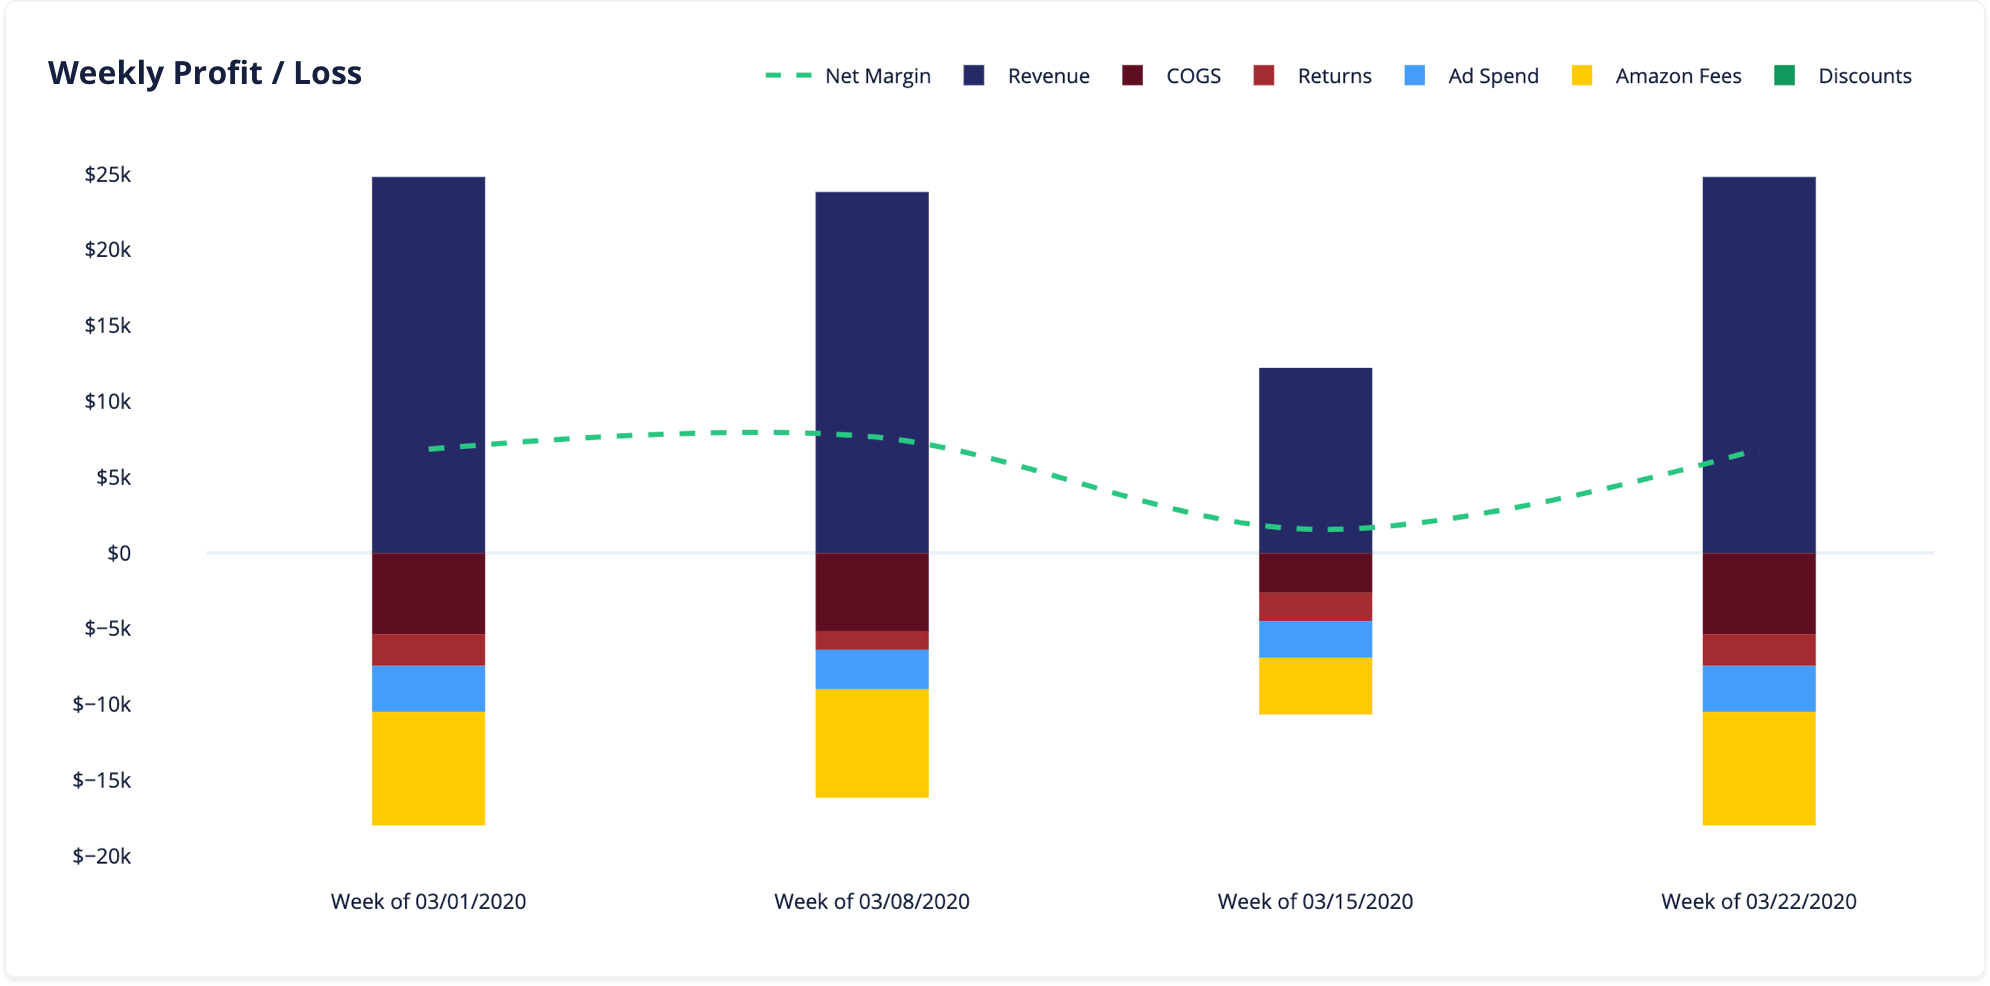
Channel Financials
Add your Cost of Goods detail as often as you want and get a living channel profit and loss statement over time period including month-over-month based on moving average cost.
You can select your report date-range to get your data based on your financial calendar (ie retail calendar, fiscal year or month).
All selling fees are included on reports.

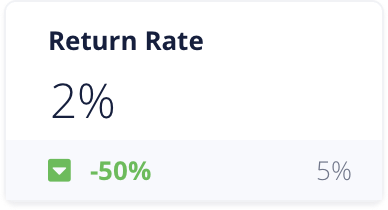
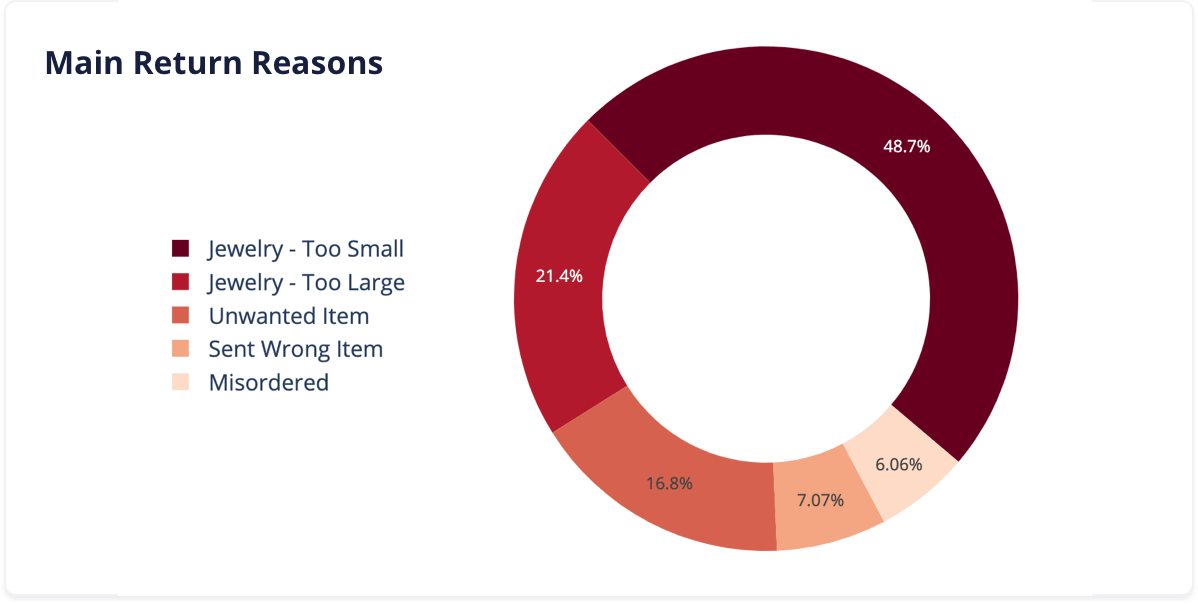
Returns Data
Understand what is driving your returns, including overall return rate, return reason and top returned SKU all over time and based on order date to take action on improving return metrics.
Start Making Better Decisions with Alyte.
Easy to read insights that are beautifully visualized, interactive, intuitive and present action-oriented information on channel and product performance.